The Challenge
Residential flood risk in Canada is estimated to cost $2.9B per year, yet there is low awareness and a lack of information accessible to homeowners (Canada, 2022). Pluvial events (i.e., extreme rain) are one of the main flood-driving mechanisms that affect property including buildings, automobiles, and their contents. Impacts associated with such events are compounded by sub-optimal drainage and performance of storm water management systems, such as when soils are saturated and debris clogs drainage paths.
Currently, there is no source for interested parties to obtain Canada-wide, easy-to-interpret, visual and quantitative information about pluvial flood risk at scales necessary to meet the needs of individual property owners, investors, insurance agencies, and urban planners. Given the magnitude, reach, and emerging trends associated with flood risk, it is becoming increasingly important to make pluvial flood awareness information available such that interested parties can consider necessary action, if warranted, to reduce their flood risk.
Our Solution
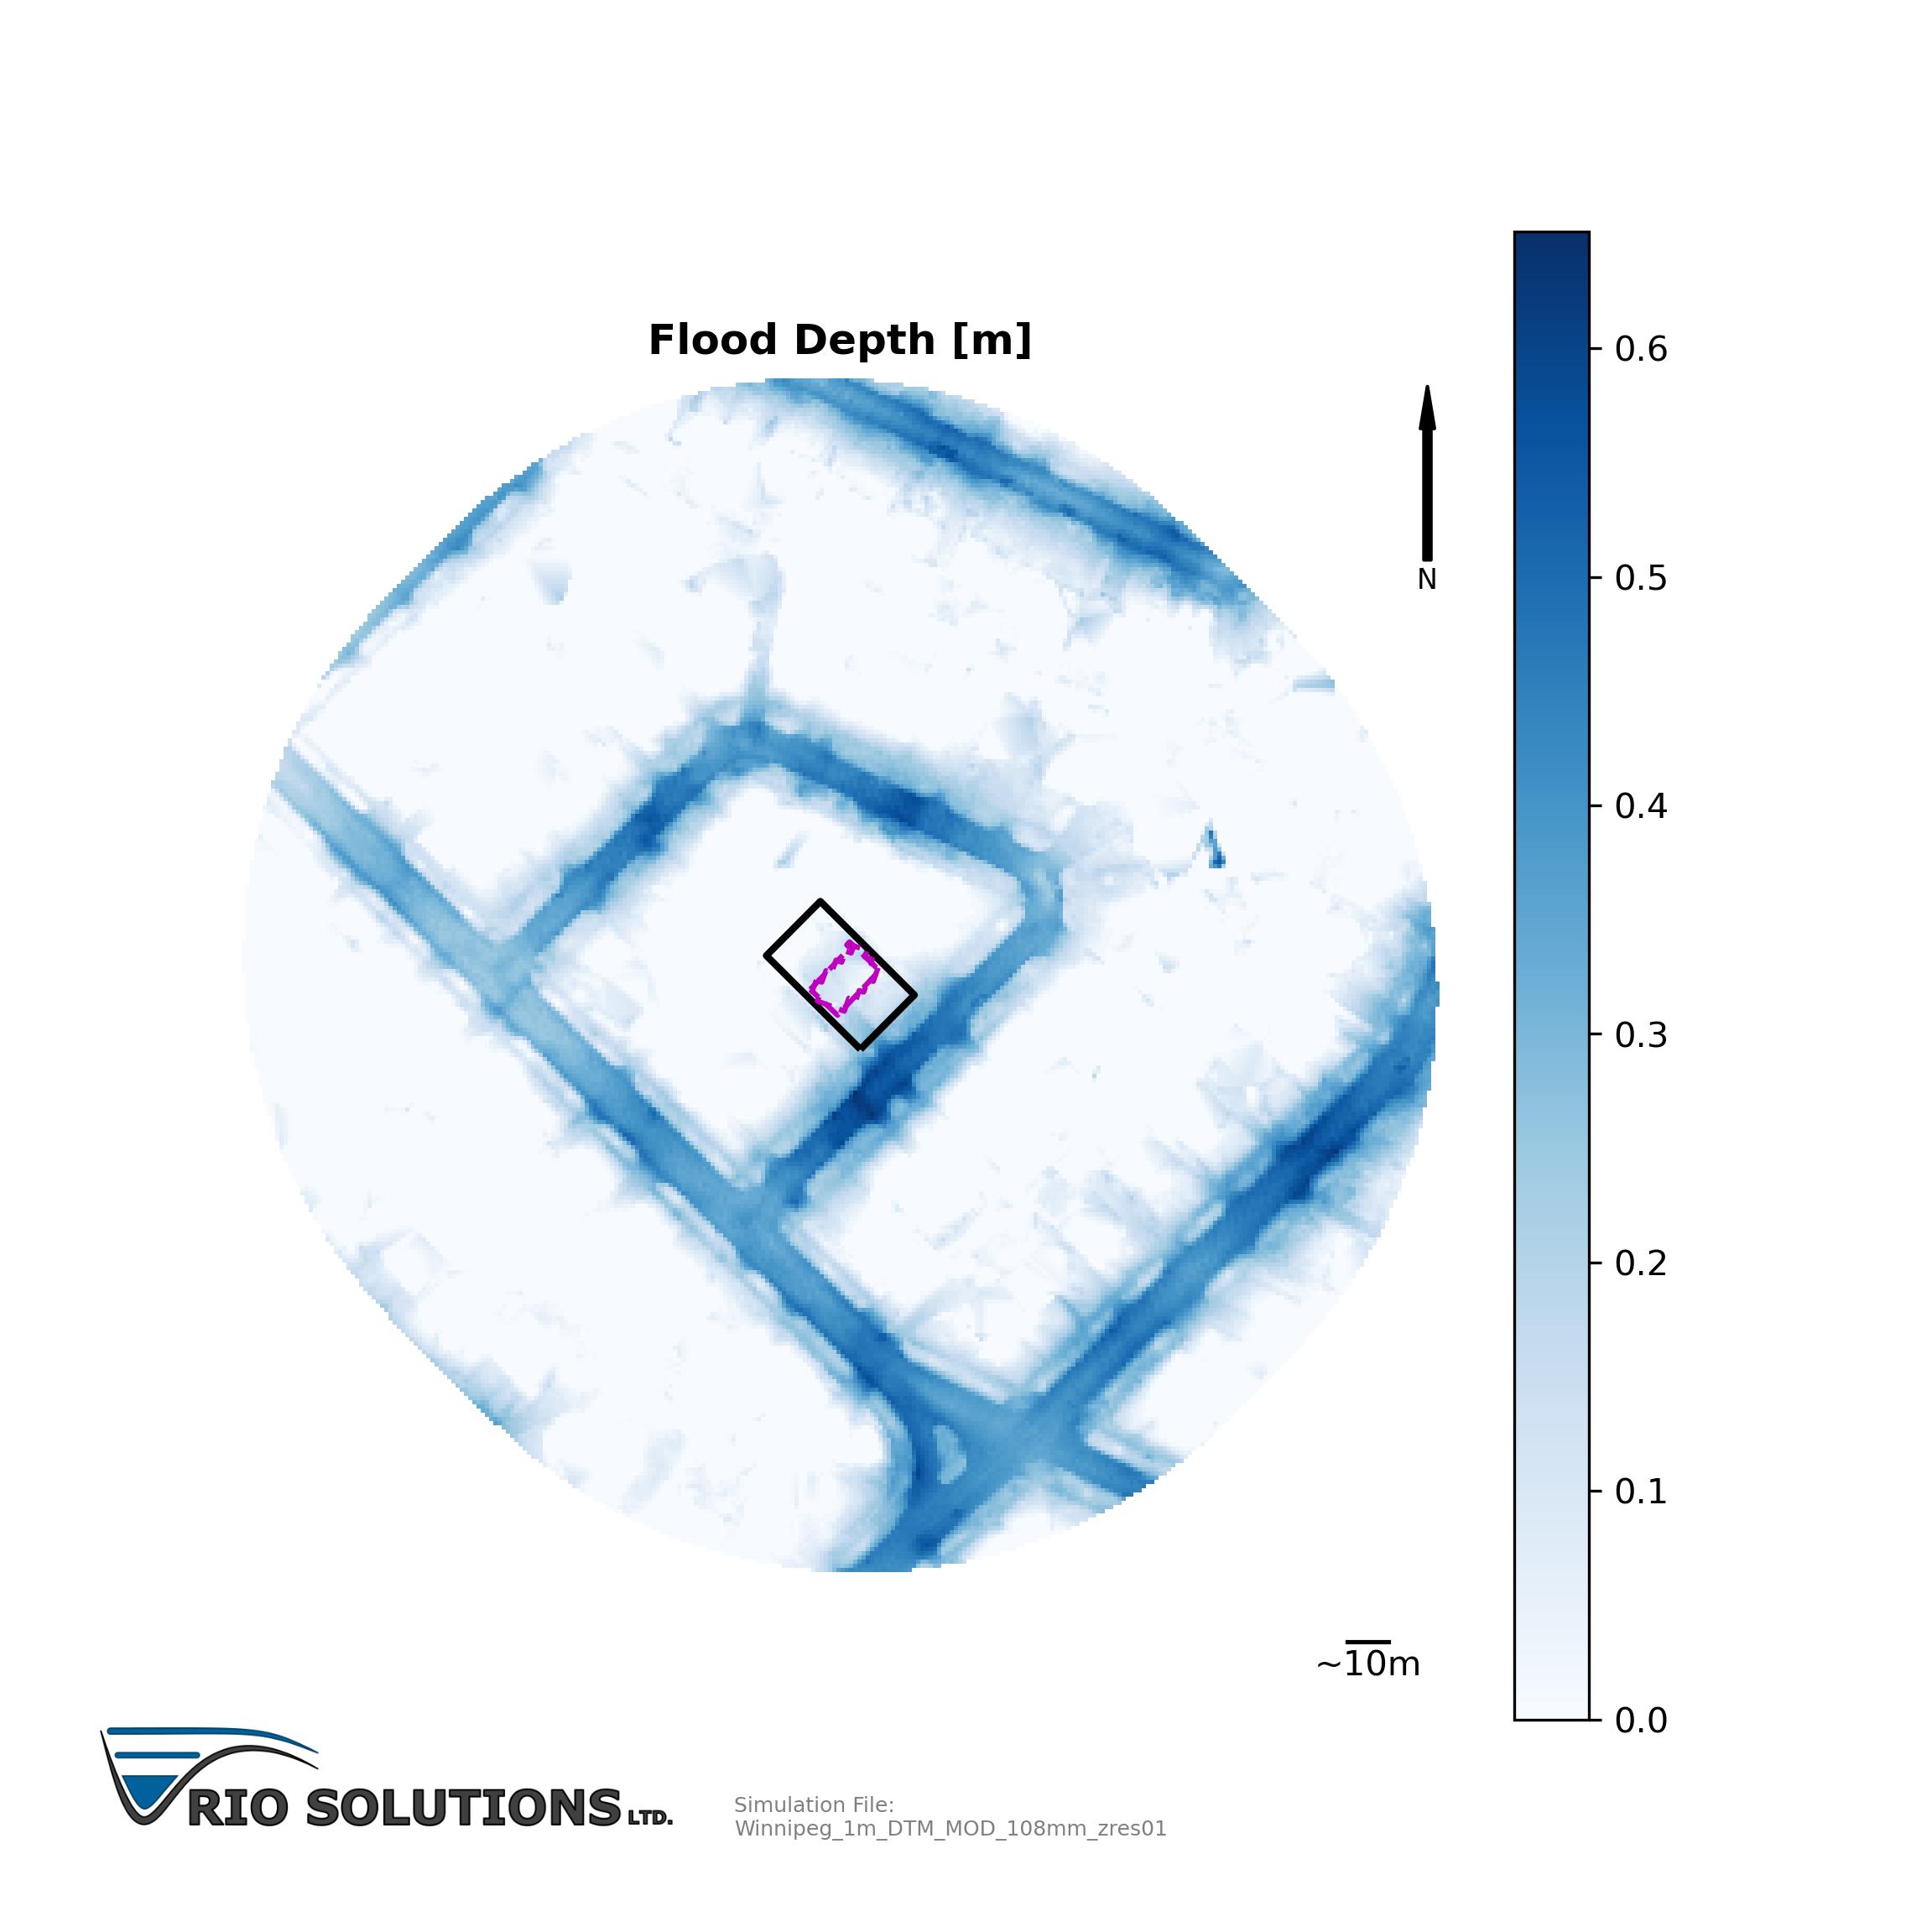
We use high resolution datasets, custom Python scripts, and dedicated computers to model hypothetical scenarios of extreme rain and poor drainage. Our models output maps of flood depths which can help interested parties visualize and explore their potential flood risk at scales relevant to individual property owners as well as larger scales of interest to urban planners and insurance agencies.
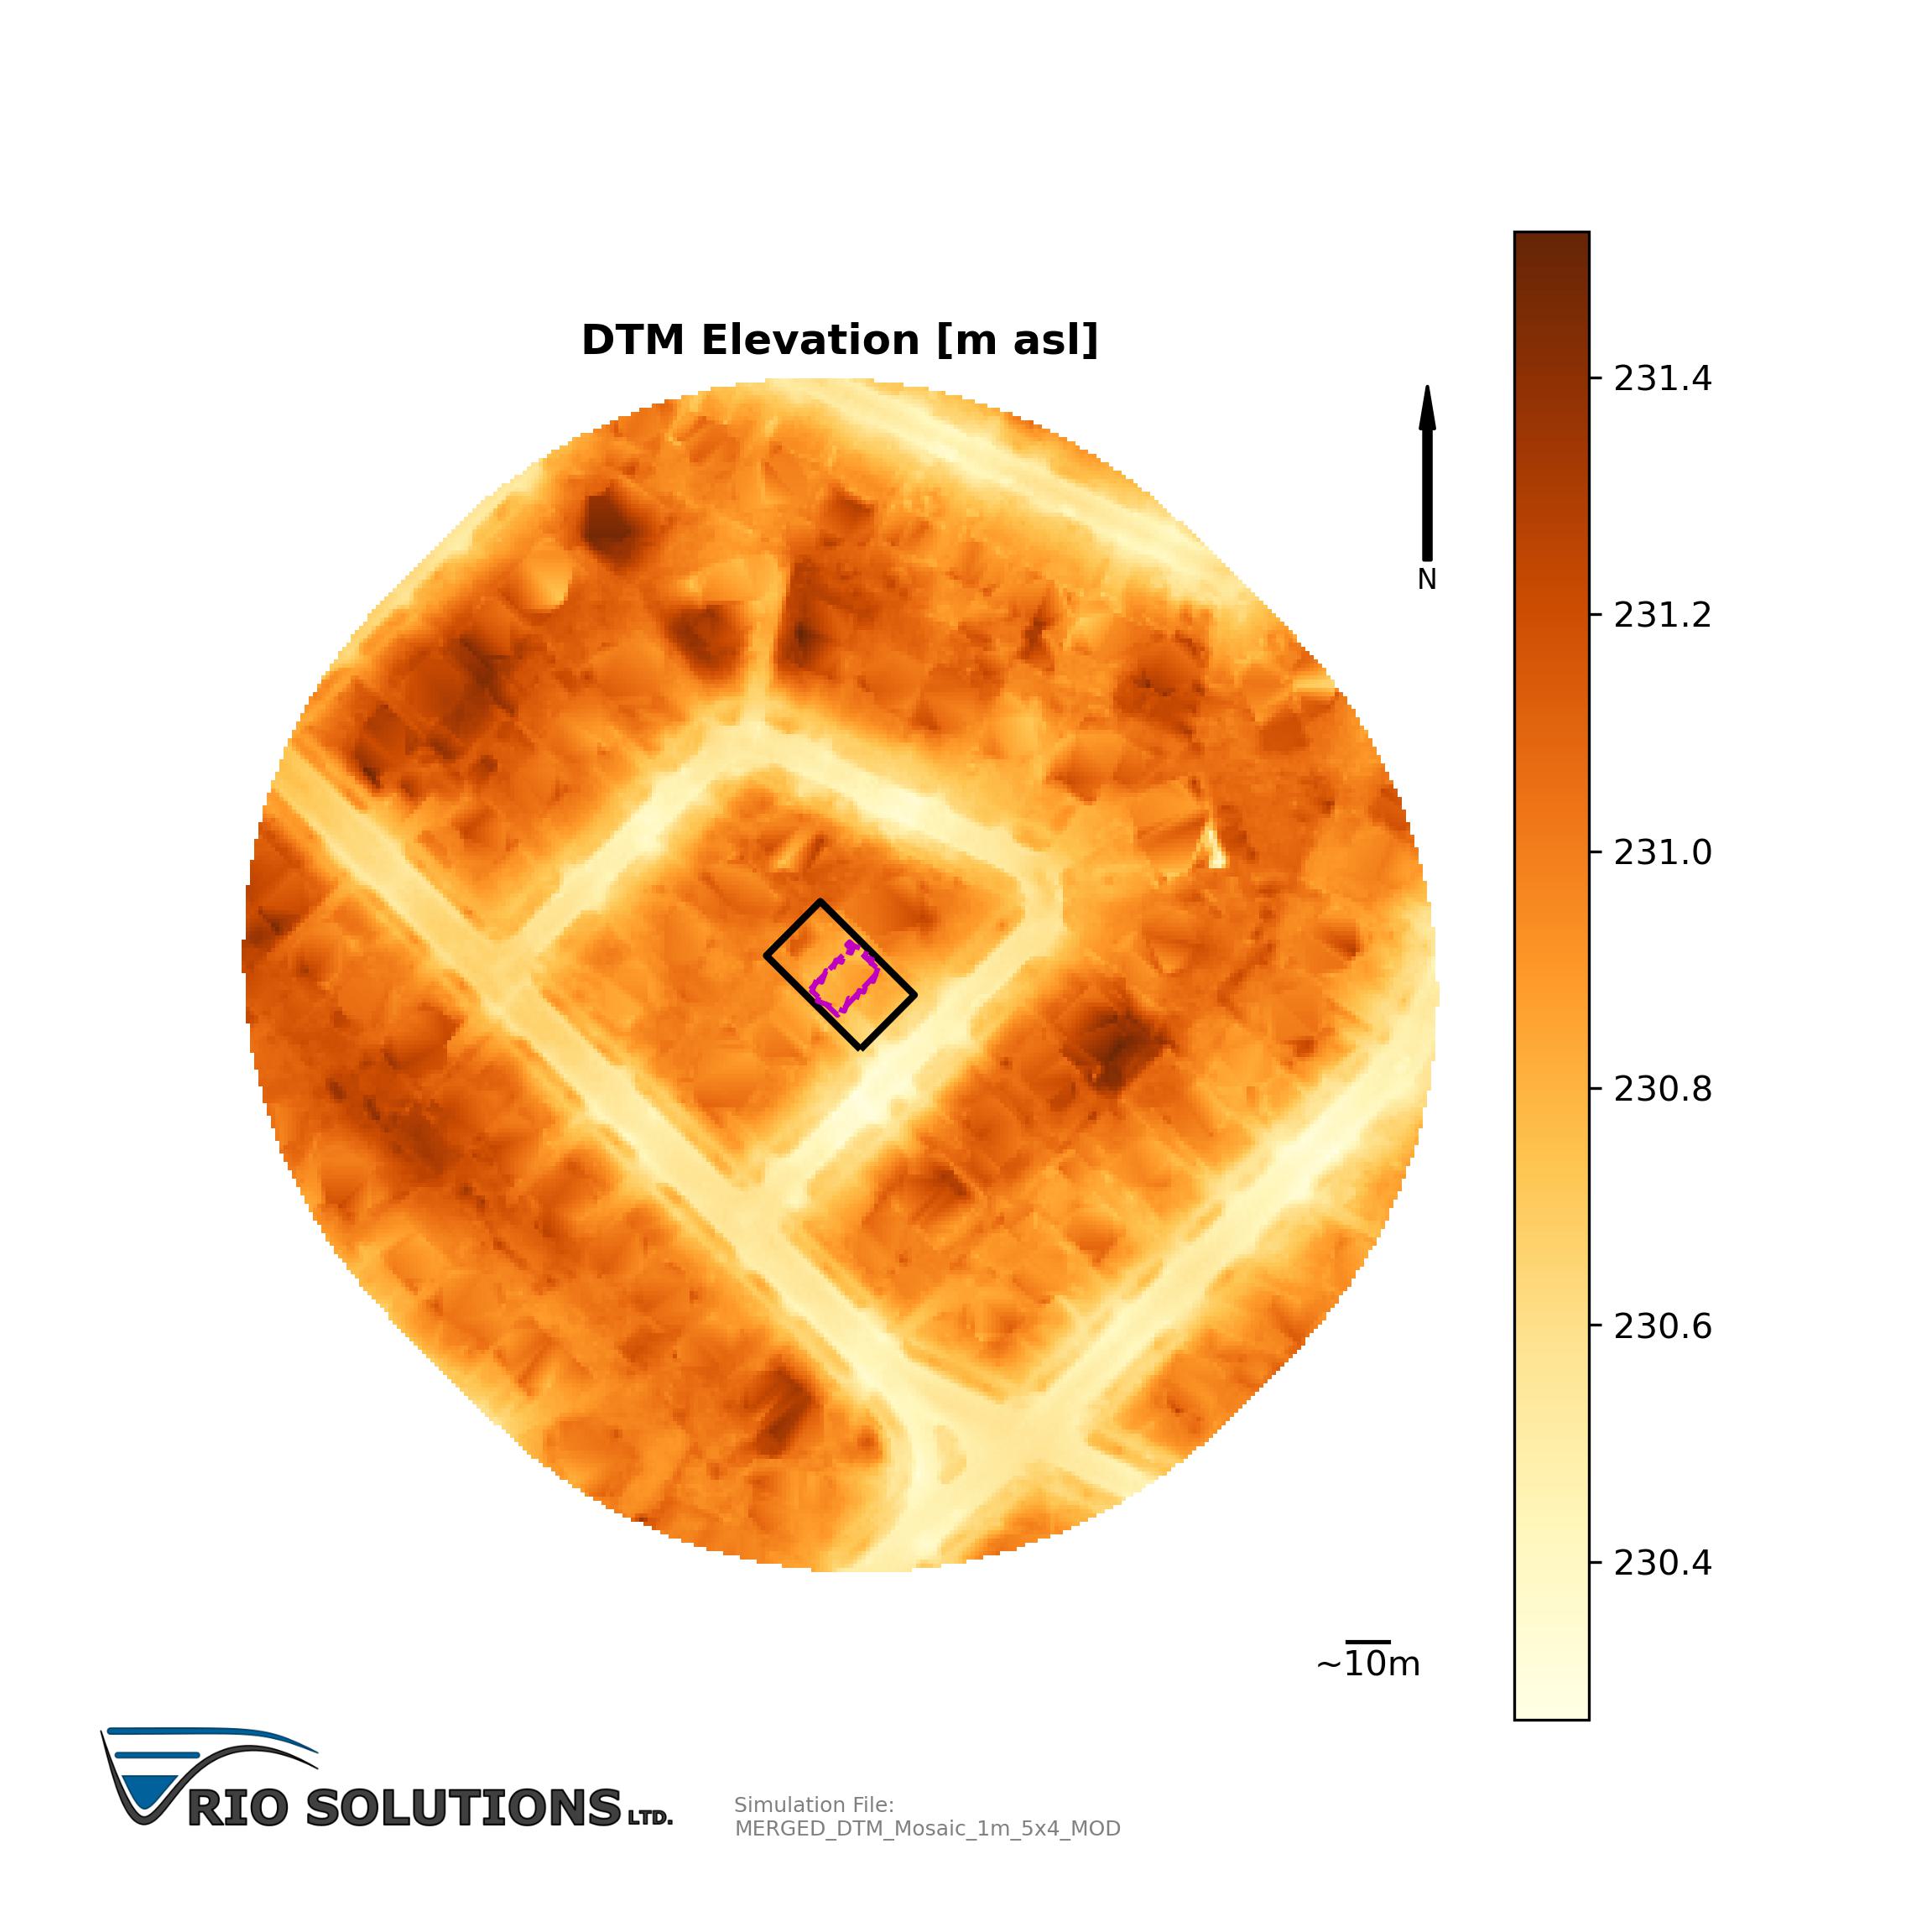
The datasets we use include Digital Terrain Models (i.e., elevation data) obtained using Light Detection and Ranging (Lidar) technology which have been processed to determine landscape flow directions and local depressions (low spots) which can fill with water. Precipitation data are primarily derived from Environment and Climate Change Canada (ECCC) observations and associated statistical properties such as the 1-in-50 year event (National Building Code of Canada, 2020).
The computer scripts are based on scientific methods that discretize the modelling domain in a fashion that efficiently manages high computational demand. Scripts are designed to output maps of water depths that exceed 0.05m, a typical bias in Lidar based elevation data and a relatively shallow puddle which can be easier to manage in comparison to deeper puddles. Even with a high performance computer, city-wide simulations take several days to run an individual precipitation event.
Model outputs are processed into easy-to-read pdf reports that utilize visuals (i.e., maps) to convey model results in a meaningful and concise fashion. Maps include property outlines, and approximate building perimeters (where available) to help users orient themselves with the flood depth data, shown as coloured grids in the maps. Our reports also contain some complementary information regarding a property's proximity to select Designated Flood Areas (DFAs) which represent flooding due to fluvial events (i.e., river flooding).
Want to see an Example Flood Awareness Report?
Regional Availability
The interactive map below outlines the regions where we currently have Flood Map data available. If your property falls within the shaded areas outlined in a dark blue line, it is included in our model. A couple of side notes: Our model extends beyond these limits, but we use a buffer to exclude properties along the edge that may be subject to edge effects. We also have a map showing individual properties but the dataset is quite large and slows down our website performance.